The article is about the trading guide for Footprint Charts. Order flow traders frequently use footprint charts. They provide an inner view of the candles, displaying the trade’s volume. Suppose you are examining the stop run on a straightforward candlestick chart. You could only guess if any participants were stopped out in the wilderness.
Footprint charts are designed to help traders profitably use the massive data that markets generate. They display volume and order flow. The charts provide transparency and give users a deeper understanding of real-time trading activities. They improve information content, which is essential for traders.
Also, the RSI Divergence indicator is one of the most well-liked and well-known trading indicators available. If you use RSI Divergence like a pro in forex, you can trade seamlessly. Many use it to evaluate markets and look for valuable entry points and exits.
But we can be considerably more specific about this information when we employ order flow tools like the footprint chart. This article will review the fundamentals of footprint charts before demonstrating a few different applications.
See Also: Mobdro Alternatives For Online Streaming | Top 12 Picks For 2023
How Do Footprint Charts Work?
A specific kind of candlestick chart known as a footprint chart shows extra data in addition to prices, such as trade volume and order flow. It is multidimensional and can give an investor access to data other than the security’s price for additional study. The benefit of footprint charts is that they read and comprehend order flow. You can better understand market supply and demand thanks to this.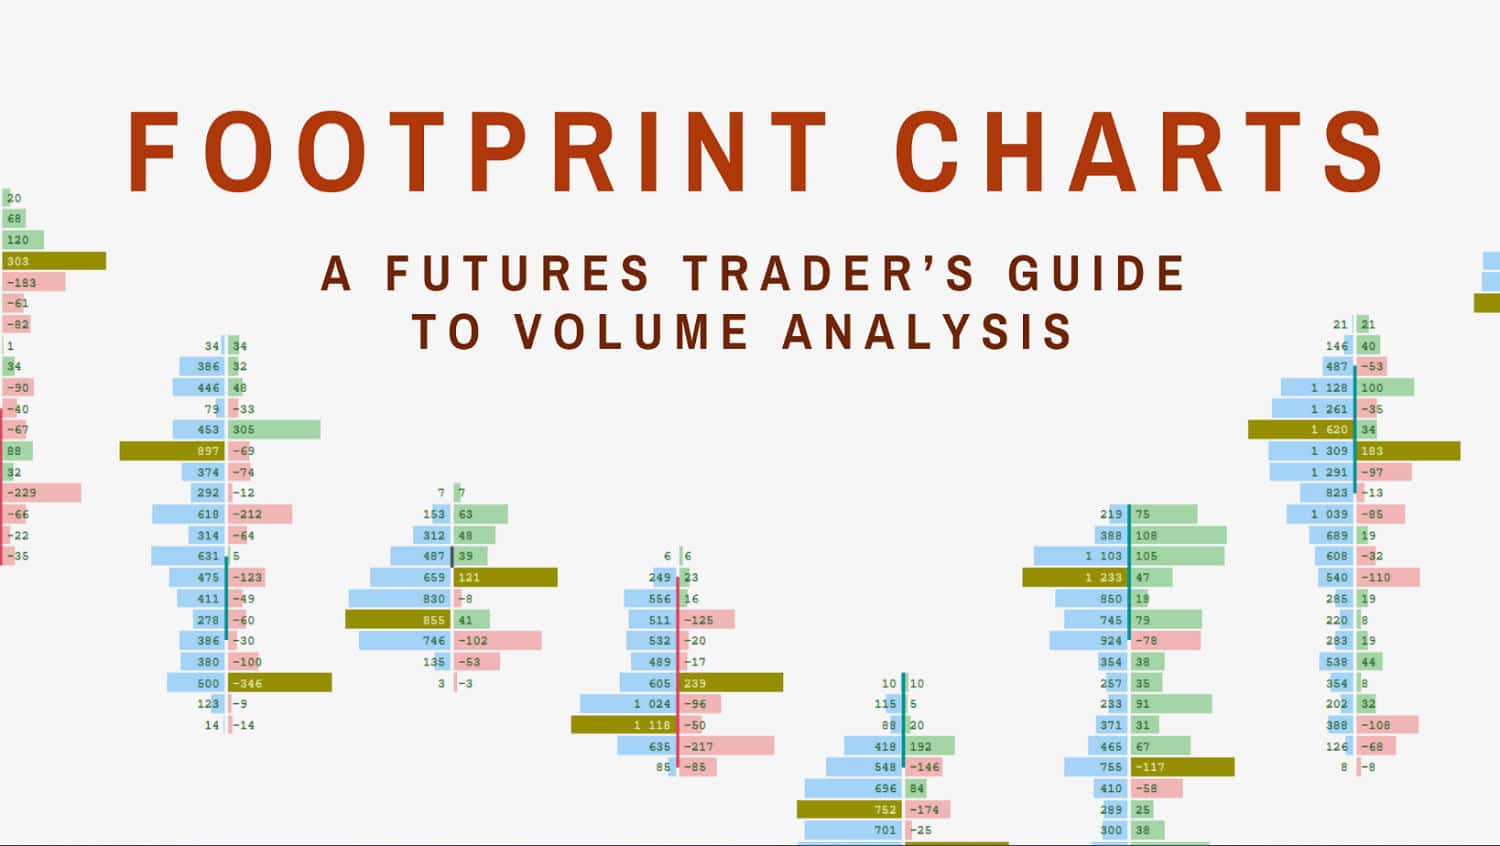
Let’s go through the fundamentals. You must purchase something at the ask or offer price. Among the top charting software, this is a novel offering.
How to Interpret Footprint Diagrams?
Trading professionals can view different market characteristics, such as volume, bid-ask spreads, and liquidity levels, layered on a candlestick chart using footprint charts, which are multidimensional diagrams. Traders can alter footprint charts to reflect the factors they are most interested in monitoring.
Similar to traditional candlestick charts, traders can alter the chart’s time frame to examine the security’s movement over the short, medium, or long term.
Footprint charts provide the advantage of using a concentrated diagram to analyze several variables. These charts categorize other multi-variable charts experienced traders use, such as level 2 quote charts or depth of market (DOM) charts.
One of the most well-known software companies that offer footprint charts through monthly subscriptions is MarketDelta. The MarketDelta platform links with several of the biggest brokerage firms to enable trade automation. MarketDelta also provides a wide range of customizable data feeds for a price.
How are Footprint Charts advantageous?
Footprint charts provide the advantage of using a concentrated diagram to analyze several variables. These charts categorize other multi-variable charts experienced traders use, such as level 2 quote charts or depth of market (DOM) charts. Similar to traditional candlestick charts, traders can alter the chart’s time frame to examine the security’s movement over the short, medium, or long term. A successful interpretation of Footprint Charts helps gain more profits; you can also check out quick and easy ways to calculate crypto profits.
Explanation of Footprint Chart Trading Strategies
The tactics for novice and seasoned traders will be covered in the following sections. It is easy to read the Footprint Chart. You will initially see a lot of statistics without understanding their significance. We now provide a method for using the Footprint Chart to identify a market reversal. The red box indicates the normal reversal in the image below.
After performing a chart or volume analysis, the Footprint Chart entry should be found. Using the Footprint Chart alone would be a blind trading bot, so we do not advise doing so. You also need to pay attention to several crucial price points. Here’s what happens in trading strategies :
Here’s what happens:
- Traders only sell six contracts.
- Because there are additional buy limits, no more sellers can enter, keeping the price from falling.
- Traders often prefer low-pitch.
- There are more buyers than sellers.
- A reversal is indicated by low loudness.
Various Footprint Charts
Through a charting provider, a variety of footprint charts may be made available. Footprint charts use intricate designs that allow users to overlay extra market data on top of a candlestick chart. Information on volume, bid-ask spreads, and liquidity levels are all included. Like candlestick charts, traders can alter the chart’s period to study price movement over the short, medium, or long term. The precise variables traders are most interested in the following can be added to footprint charts.
If you’re looking to enhance your trading experience with innovative tools, consider exploring One Ticker Trader, a platform that aligns with the principles of footprint charts, providing a deeper insight into market dynamics and order flow.
The following are some of the most popular footprint charts utilized by traders:
Footprint profile
In addition to the standard footprint bars, the profile displays a vertical histogram informing traders of the volume at each price.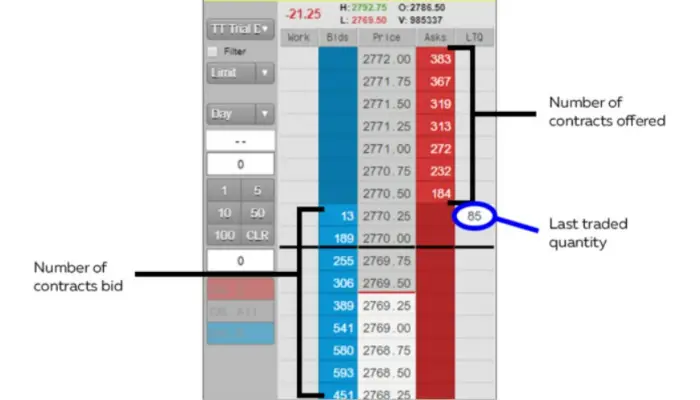 Traders can determine the prices at which liquidity pool by using the.
Bid/ask footprint
Adds color to the real-time volume to make buyers and sellers examining the bid or ask more easily visible. Using this footprint, traders can determine whether the buyers or the sellers are to blame for a price change.
Delta footprint
Shows the net difference between volume started by buyers and sellers at each price. The delta footprint aids traders in determining whether a price trend has begun and will last.
Volume Footprint
In contrast to the volume histogram on conventional charts, the volume footprint divides the volume into price and time segments.  This graph intends to assist traders in identifying capitulation points.
Customizing the Footprint Chart
Which option you can customize always relies on your trading apps. The number of chart types that are available as footprint charts exceeds 10. Changing is simple with the menu or shortcuts. Additionally, you can modify the settings for the colors, vpoc, and bid/ask imbalance. We are utilizing the order flow software ATAS in the image below to demonstrate several examples.
FAQs
How do trading footprint charts work?
The footprint provides a peek of a bid x ask transaction for each value. For each price, buyers and sellers exchange goods and services. The purpose of a footprint is to disclose information about the amount of quantity that has been traded between the buyer and seller.
How is absorption defined in a footprint chart?
Absorption occurs when there is an exceptionally high trade volume near the highs or lows of the bars while there is no change in the value behind the barrier or only a little one. The patterns of higher-than-normal volumes that appear at the supports and resistances level represent the ideal variation.
What does the bid/ask footprint chart mean, exactly?
Regardless of ask or bid, it merely shows the entire volume of contracts exchanged at each value. In this case, the Volume Footprints will show you a value of 1400, while Delta will show 500 if your Bid X Ask Footprints are 500 x 900.
What do imbalances on the footprint graph mean?
The footprint imbalances graph displays the pricing thresholds when a purchase transaction volume surpasses a sell transaction volume. Strong buy market orders drive up the offers, and strong sell market orders drive them down, as shown by the diagonal bid/ask imbalances.
Can brokers modify footprint charts?
Traders can alter footprint charts to reflect the particular factors they are most interested in monitoring. Similar to traditional candlestick charts, traders can alter the chart's time frame to examine the security's movement over the short, medium, or long term.
See Also: 17 Currency Converter Apps For iPhone In 2023 [Latest]
Conclusion
In conclusion, footprint charts offer a significant advantage compared to most standard charts. They also display volume and order flow in addition to the price. Thanks to the data display’s logical structure, using the volume and order flow data is feasible without looking at the order book. You can alter many footprint charts to suit your interests and trading methods. In this post, we’ve touched on a few ideas and demonstrated how footprint indicators add to a trader’s approach to provide them an advantage.